Causes that will have an effects on XAUUSD (GOLD)
- The Fed Minutes released on Wednesday showed that “various participants mentioned a willingness to tighten policy further should risks to inflation materialize in a way that such an action became appropriate.”
- The Minutes also suggested that the Fed officials grew more concerned about the stubbornness of inflation, citing that “the recent monthly data had showed significant increases in components of both goods and services price inflation.”
- In Thursday’s trading so far, Gold price is consolidating the downside, drawing support from a pause in the US Dollar uptrend, as risk sentiment seems to find a boost from robust earnings report of the chip designer and artificial intelligence (AI) giant, Nvidia. Nvidia’s profits and revenues skyrocketed by 628% and 268%, as against 2023’s comparable period, respectively.
- However, a sell-off in the Chinese stocks keeps investors on edge. Therefore, Gold traders look forward to the flash readings of the S&P Global US Manufacturing and Services PMIs for affirmed the recent hawkish shit in the Fed’s rate outlook, which could trigger a renewed US Dollar advance.
Weekly Gold Forecast Direction : Sideways Down
- Recession in Europe and persisting problems in China’s property sector to heavily impact iron ore demand
- While inflation refuses to go away, gold refuses to go up
- FOMC Minutes don’t offer any hope for gold
- Every news is bad news for gold
- Strong dollar weighs on gold
- Demand for gold as insurance against inflation promises to decline
XAU/USD Technical Overview
Gold price opened Thursday below the lower boundary of a five-week-long rising wedge formation, currently at $2,384. Daily closing below the latter would confirm the rising wedge breakdown, opening the floor for a test of the 50-day Simple Moving Average (SMA) at $2,307.
However, Gold buyers must first defend the 21-day SMA support at $2,350. A retest of the May low at $2,277 will be inevitable if the downside sustains.
Meanwhile, the 14-day Relative Strength Index (RSI) has slowed its descent while holding above the midline, near 54.60, suggesting that Gold price could meet some bargain-hunting demand. If Gold buyers manage to avert a downside break of the rising wedge, a rebound toward the $2,400 level will be staged.
Further up, the previous day’s high of $2,427 will be challenged. The next relevant upside target is seen at $2,453, the upper boundary of the bearish wedge.
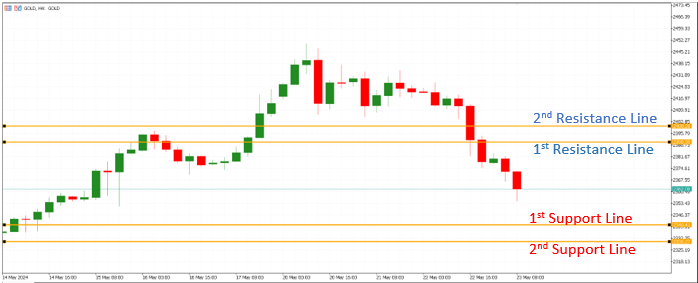
Technical View
1st Support Line 2340 1st Resistance Line 2390
2nd Support Line 2330 2nd Resistance Line 2400
Note: The above information may be inaccurate. Investors should not use this as a basis for deciding to place a trade.